Customer insights guide
Contents
Introduction
Esendex Connect SMS customer insights help you track your messaging activities, including transactional, marketing, and conversational messages. You can compare your performance over time and spot trends easily.
Utilising these statistics allows you to make informed decisions that can enhance customer engagement. By optimising the content of your messages, timing, and resource allocation, you can significantly improve the effectiveness of your communication strategies.
Video
For an overview of SMS Insights, please watch this video. You can also continue on and learn more about the functionality available.
Homepage Dashboard
The homepage will display a high-level overview of your messaging activity for the current month to date and Delivery rates, in near real time. It is made up of five sections.
The five sections will cover outbound messages (sent messages, sent parts), inbound messages (Received messages, received opt-outs) and delivery rates (percentage of messages successfully delivered).
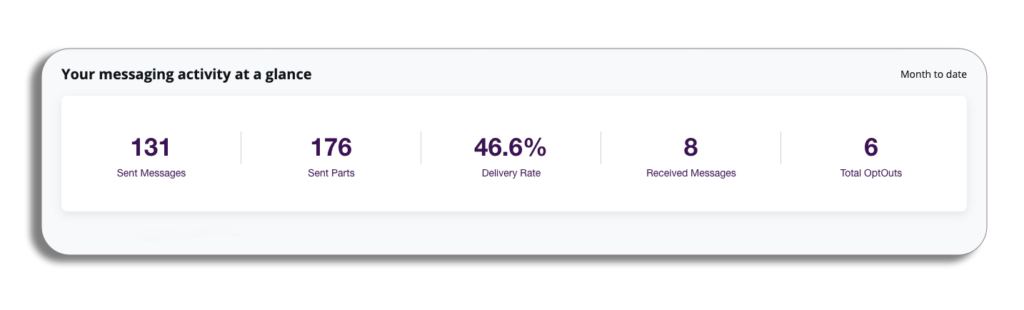
Please be aware: These will be fixed for the current month to date and cannot be edited.
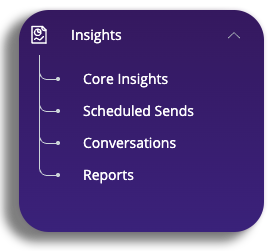
Accessing Insights
You will be able to access insights from the homepage in the left column. Selecting insights will give you a dropdown with the following sections: core insights, bulk send, conversations, and reports.
Now, let’s take a look at each of the sections with insights.
Insights features
Dropdowns
All three dashboards and the reporting section’s four dashboards will have access to filter dropdowns, which can be used to display statistics & graphs.
Please be aware: Data cannot be downloaded from the graphs created using the filters on each of the three dashboards. You will be able to do so in the reporting section.
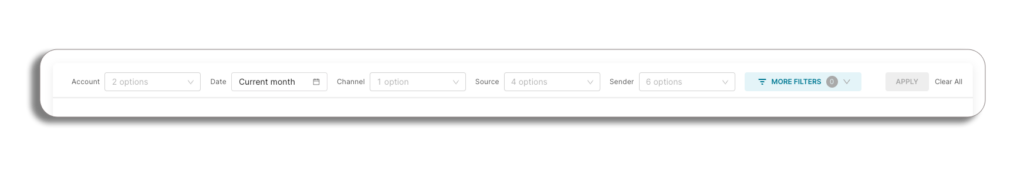
You will have access to several dropdowns, which will reflect what will be shown on the page. These dropdowns are not exclusive to core insights and will be available to use in all four sections. Let’s take a look.
- Account: This is the account reference and will be pre-populated based on the account you have logged in with.
- Sub-accounts will be accessible from this drop-down in a future update. This will show all sub-accounts for which we have a billing marker (This may change in future updates).
- The user will see downwards, not upwards, in the hierarchy.
- Date: Please see the date section for a more in-depth look.
- Source: This will show how messages were sent – i.e. if they were sent by API or from the portal.
- Channel: you can analyse how different channels perform for different audience segments. This feature helps you find out which channel works best for a specific group.
- Sender: You will have the option to choose specific Sender IDs or select all of your Sender IDs at once.
- Destination: Utilise this dropdown menu to select one or more destination countries for filtering.
- Message status: choose to view messages based on their delivery status. Available options include Delivered, Failed, or Sent.
- Message Type: filter messages based on one or more of the types you selected when sending them. This helps streamline your communication and makes it easier to find specific messages.
- Scheduled sends: Additional filters are available for you, which cover names (for scheduled campaigns) as well as the status your send is at and its type (scheduled or throttled)
Date
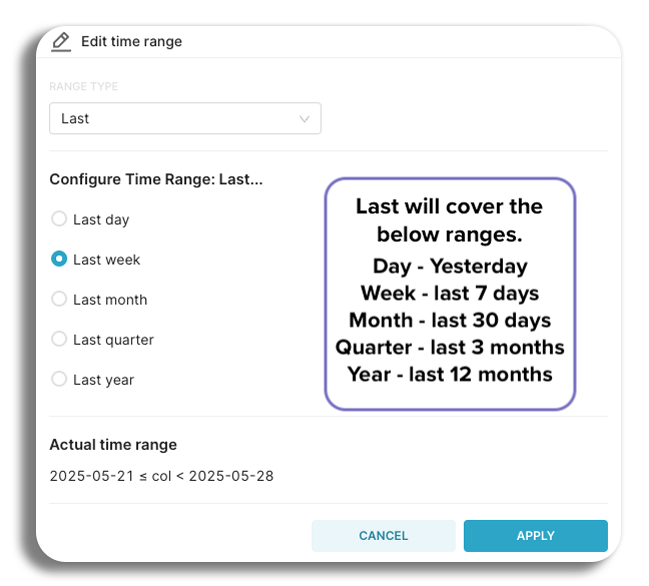
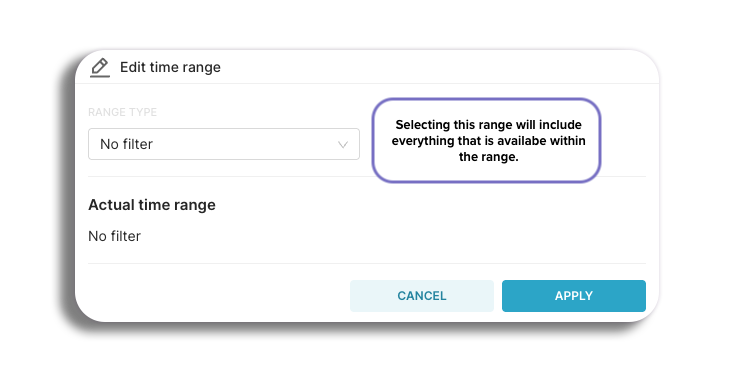
Here you will be able to set the range type and time to show your results. You will have several options on how you can set your date range. Select the drop-downs to learn about each range.
Last
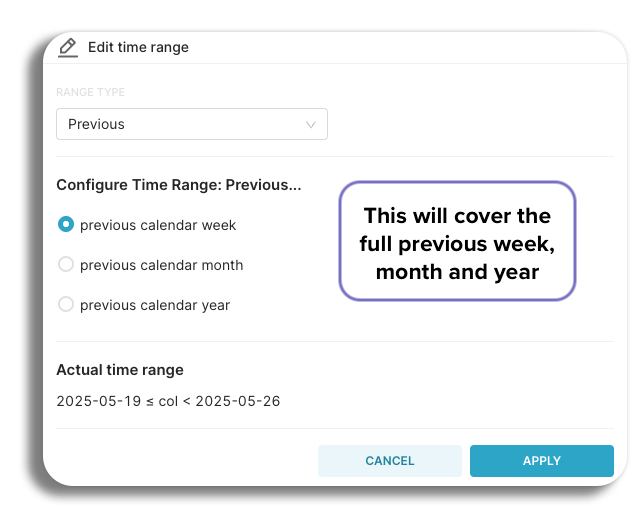
Previous
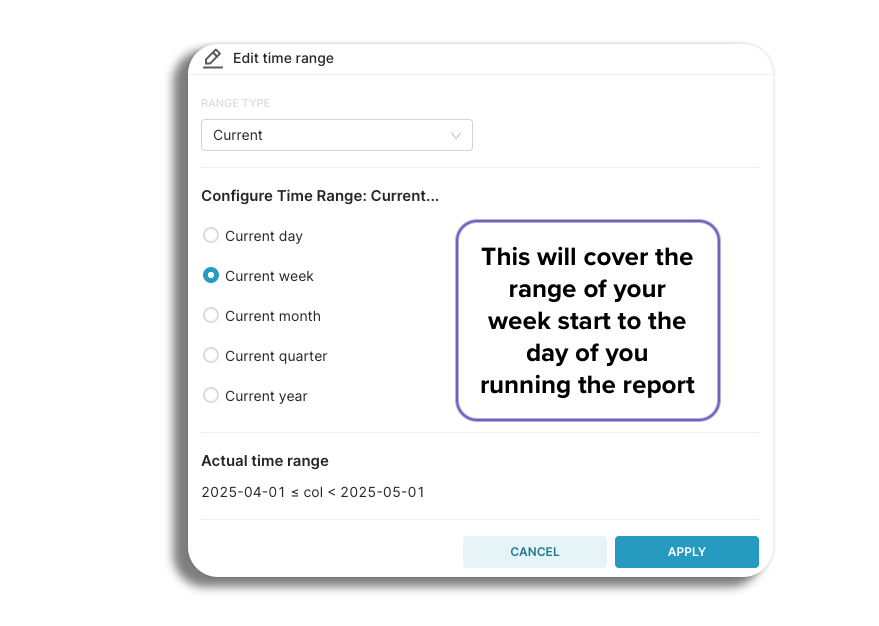
Current
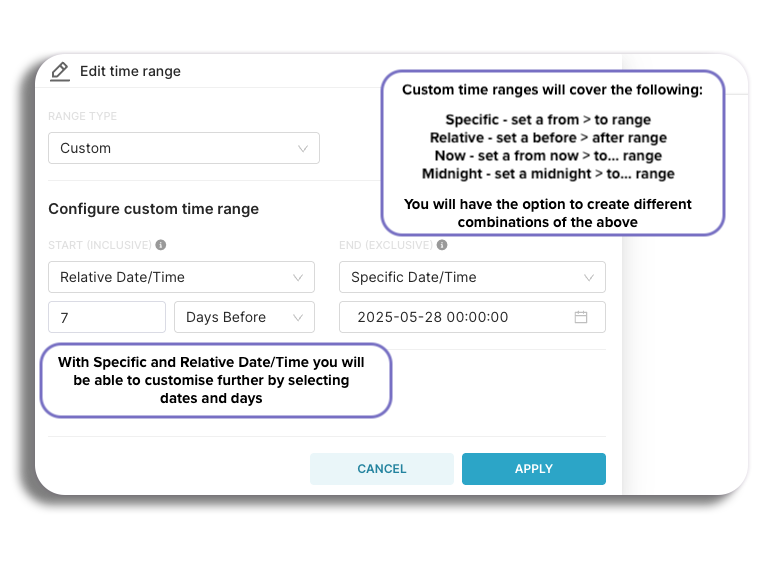
Custom
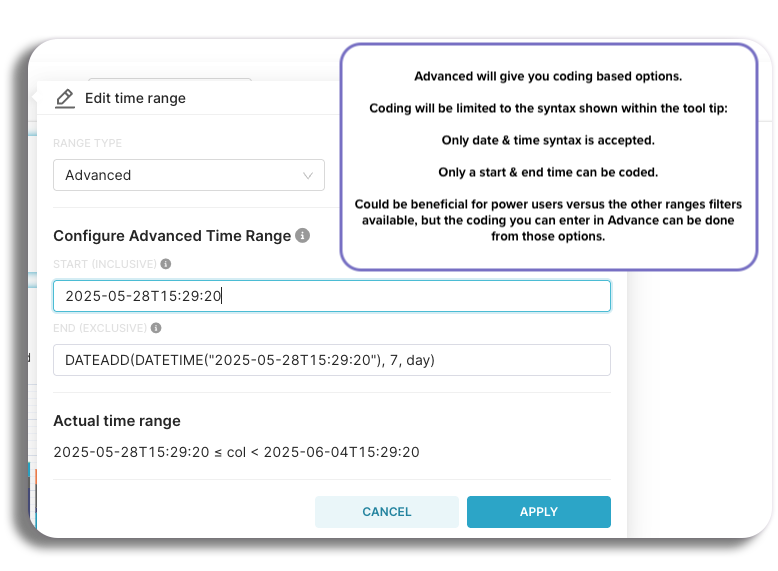
Advanced
No Filters
Graphs
Graph filters will be available on core insights, scheduled sends and conversations. This will give you a breakdown of all messages sent by their message type.
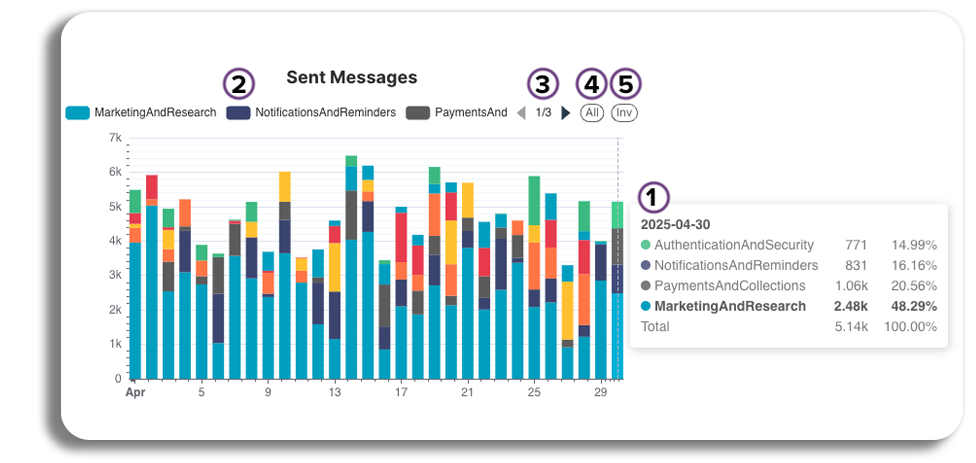
- Hovering over the graph will give you a breakdown of all of the message types sent on a specific day. The type of message you hover over will be highlighted in the breakdown displayed.
- To view one message type in isolation, click on any section for that message type on the graph.
- Selecting one of the sections will also update the overview numbers on the page to match the section you have selected.
- Double-click on a message type you have selected to only display that type on the graph, making it easier to view its send volume over different time periods.
- Just above the graph, you can see the message types with their matching colours. Selecting one of these will remove it from the graph, You are able to remove all of them by selecting each message type and returning them by selecting the type again.
- Select the arrows here to move the message types across so they will be accessible.
- Selecting All will bring all the removed message types back to the graph.
- Inv or Inverse, selecting this will restructure the graph to show all message types you have removed by selection.
Core Insights
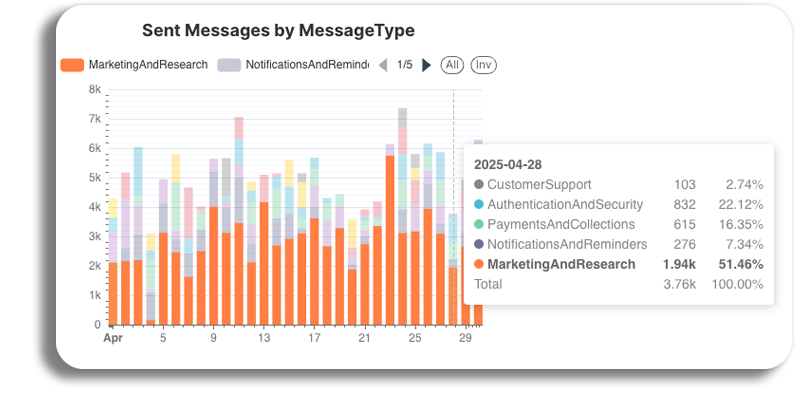
View the four basic insights of the SMS channel shown in the Summary Dashboard: sent messages, sent message parts, received messages, and opt-outs.
You will also have access to a graph here, which will cover sent messages by message type.
With the graph, you will be able to view a breakdown of all sent messages by Message type, and isolate different message types to view their send volume over different periods (You can learn more about this in our Graph section).
Scheduled sends
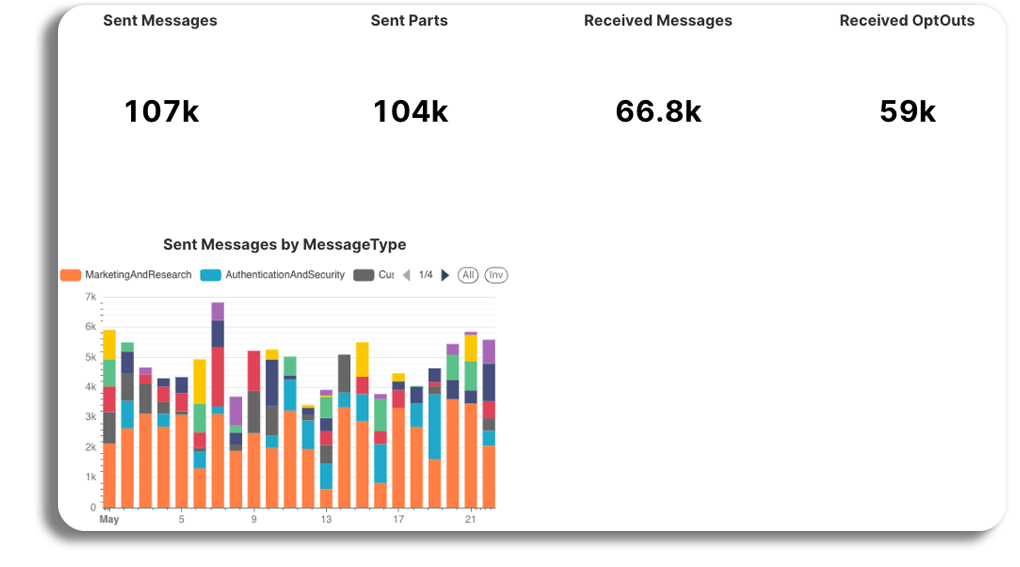
View all of the stats for all scheduled sends combined with the dashboard. This will cover Sent messages, sent message parts and opt-outs.
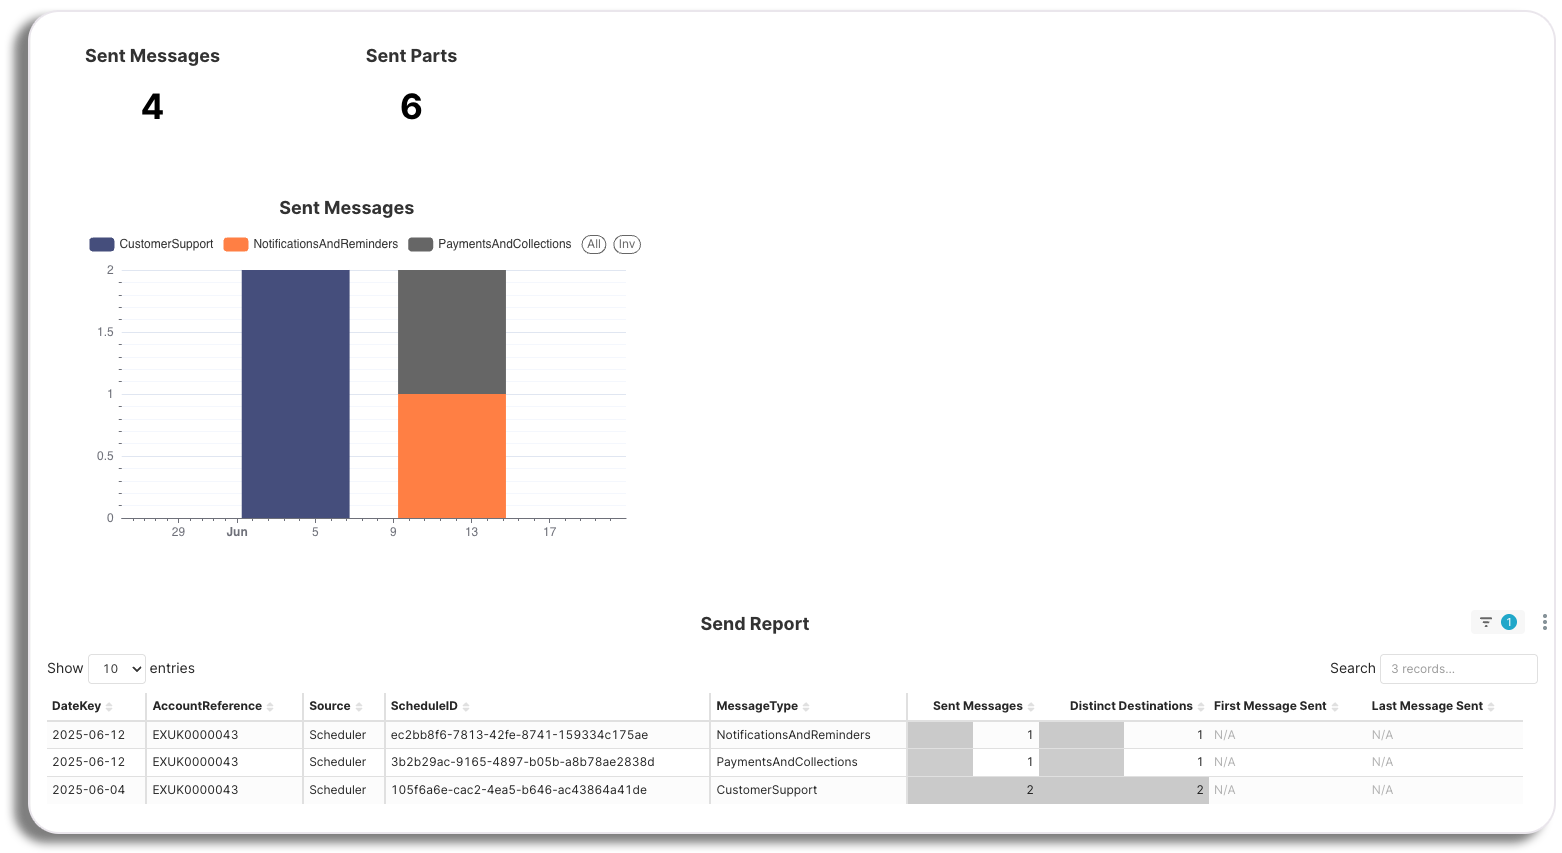
You will also have access to a graph in Scheduled sends. This feature allows you to view a breakdown of all sent messages by message type and isolate different message types to view their send volume over different periods (see Graphs for more details).
Scheduled send will also include access to the send report. Here you will be able to access data points in the report that will then be reflected on the graph.
Please be aware: the overview stats show all scheduled sends combined (in their relevant categories).
Conversations
Let’s review the conversations tab. Here you will get a detailed breakdown of SMS interactions, focusing on both inbound and outbound messages.
Users can track conversation statuses, such as new or updated, to monitor the progression of their messaging activities.
This section also includes metrics like received opt-outs, allowing users to evaluate customer responses effectively.
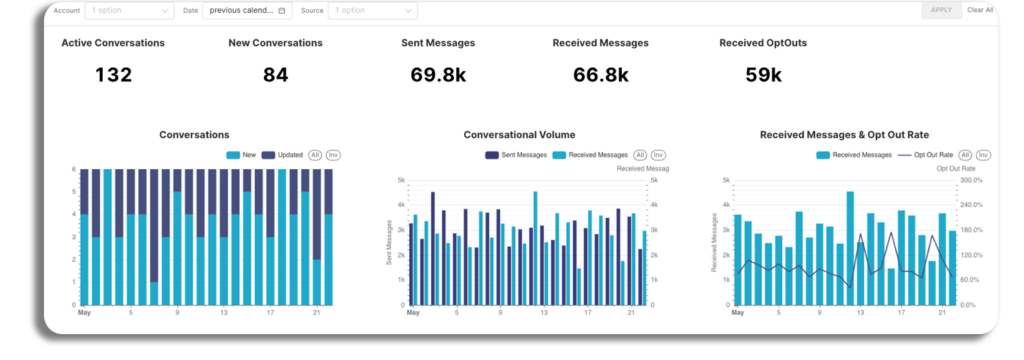
The statistics you will be able to view here are the following:
- Active conversations
- New conversations
- Updated conversations
- Sent messages
- Received messages
- Opt outs
You will also have access to Graph from the Conversations as well, with three graphs that cover the following:
- Number of conversations.
- Number of sent & received messages.
- Number of received messages and opt-outs.
- The Graphs will have the option to select types in each of them, as well as being able to isolate different periods (see Graph).
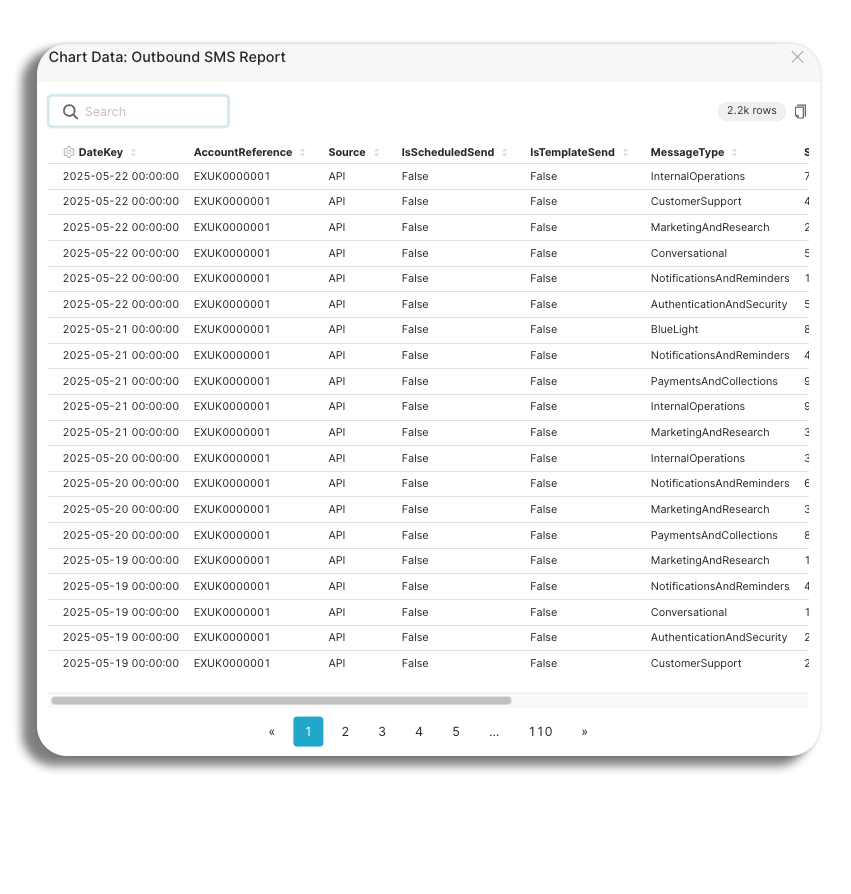
Reports
The reports section will let you download reported data. The same standard filters that we have seen in the other dashboards can be used to create each report.
There are three reports that are available to you:
- Outbound SMS
- Scheduled Send
- Conversations
Please be aware: The name a user has given to a scheduled send (e.g. a marketing campaign) is not shown in the report. An individual scheduled send can currently only be identified by its schedule ID.
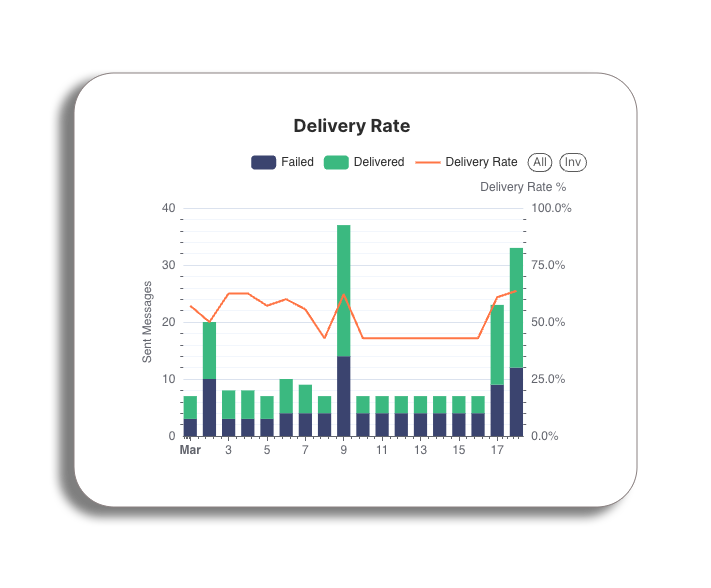
Delivery Rates
Delivery rates represent a crucial key performance indicator (KPI) in SMS Insights, reflecting the percentage of messages successfully delivered to recipients.
These rates are influenced by various factors, including the platform used and any relevant upgrades. Understanding delivery rates provides valuable insights into the effectiveness of messaging campaigns.
Filters
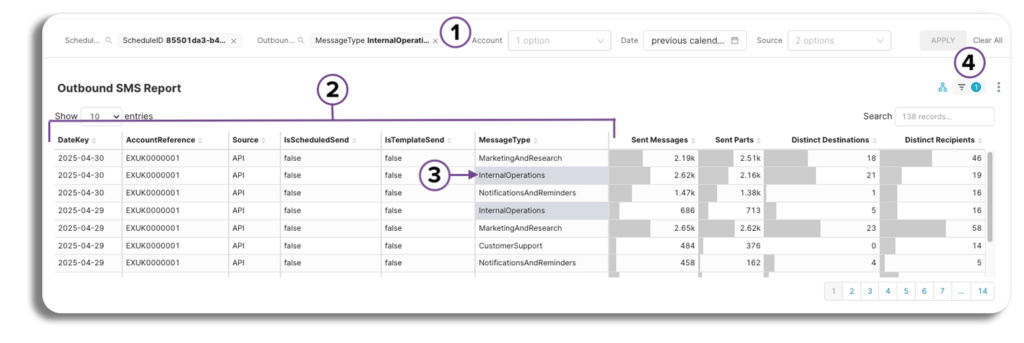
- Standard filters – You can filter each table and report using the same common filters from the dashboard (Date, Source, Account).
- Selectable data filter – Filter all tables by clicking on any selectable data point within a table, such as message type, source, account reference, and so on.
- All tables will be automatically organised to show only the specified data point, allowing for easy viewing. Additionally, the report can be downloaded per this filtered data.
- Search box filter – Filter a single table:
- You can search within a single table using any chosen data point for a more targeted retrieval of information.
- The table will be automatically sorted to showcase only the relevant data point, and you will have the option to download the report based on this selection.
- Applied filters – This will highlight what filters are currently applied to the report.
Features
Daily performance indicator
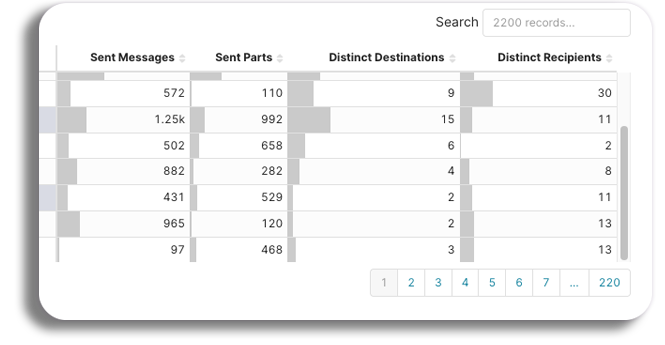
- Daily comparison of each metric reported
- Grey bars in each column indicate a specific day’s performance for a metric (e.g. opt out), compared to other days within the date range selected.
- The order of the columns in each table can be changed. (The changed order will not be reflected in the downloaded report).
Copy facility
Selecting the three dots on a report will give you access to the table function.
- Presents a clearer view of each table.
- Data can be copied & pasted into e.g. Excel, Google Sheets, etc.
Download formats
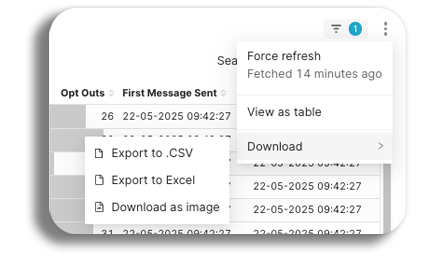
You will be able to download Reports in the following format options.
- Excel
- CSV
- Jpeg